Did you know that more than 90% of companies now run some type of loyalty program? Most ecommerce brands understand that existing customers keep their business alive. And with merchants now losing $29 for every new customer they acquire, “customer loyalty” is becoming more valuable.
But just because you slap a loyalty program on your store doesn’t mean you’ll actually gain loyal customers. You have to know whether your efforts are bringing people back or just giving away free discounts.
The good news? You can track your loyalty strategy with nine specific metrics.
In this article, we’ll show you how to measure customer loyalty, improve each metric, and use those numbers to build a program that actually works.
9 Customer Loyalty Metrics You Must Track
Do you want a quick glance at the metrics we’ll discuss? Here’s an overview for you:
| Metric | Category | Definition | How to Calculate |
| Customer Lifetime Value (CLV) | Financial Metric | Total revenue that a single customer can bring to your brand | AOV × Purchase Frequency × Customer Lifespan |
| Repeat Purchase Rate (RPR) | Behavioral Metric | Amount (in %) of customers who make repeat purchases in a specific time frame | (Number of Repeat Customers ÷ Total Customers) × 100% |
| Customer Retention Rate (CRR) | Behavioral Metric | Percentage of customers you keep over a specific period | ((Customers at End – New Customers) ÷ Customers at Start) × 100% |
| Purchase Frequency | Behavioral Metric | How often customers buy from you | Total Orders ÷ Unique Customers |
| Average Order Value (AOV) | Financial Metric | The average amount customers spend per transaction | Total Revenue ÷ Total Orders |
| Referral Rate | Behavioral Metric | Number of new (in %) customers acquired through referrals. | (Referral Customers ÷ Total New Customers) × 100% |
| Net Promoter Score (NPS) | Engagement Metric | How likely customers are to recommend your brand to others | % Promoters – % Detractors |
| Customer Satisfaction Score (CSAT) | Engagement Metric | Customer satisfaction level after specific interactions | (Satisfied Responses ÷ Total Responses) × 100% |
| Customer Effort Score (CES) | Additional Metric | How easy it is for customers to interact with your business | Average of all customer ratings (1-5 or 1–7 scale) |
| Customer Loyalty Index (CLI) | Engagement Metric | Measures overall customer loyalty | Average of 3 survey scores: (1) likelihood to recommend, (2) likelihood to repurchase, (3) likelihood to try other products (1-6 scale) |
Great! Now, let’s go over each one and talk about a few practical tips to help you track and improve them.
Metric 1: Customer Lifetime Value
Customer lifetime value (or CLV/CLTV) is a total revenue estimate of how much one customer will spend with your brand over their entire relationship with you. Here’s how you can compute it:
Average Order Value (AOV) × Purchase Frequency × Customer Lifespan
Let’s say Susan, one of your regular buyers, spends around $80 each time she shops from your store. She makes around four purchases in a year and has been with you for about three years now. So that’s: $80 x 4 x 3 = $960. That’s her CLTV and her projected value to your business over time.
Your CLTV is one of the best ways to monitor how good your customer loyalty strategy is. If its ratio to CAC (customer acquisition costs) is at 3:1, then that means you’re earning more than what you spend on marketing efforts in getting new customers (like paid ads, paying for SEO, etc.)
Plus, calculating this metric also helps you identify which marketing channels bring the most valuable customers. If email subscribers have a $900 CLTV while social media followers average $400, it’s already obvious where to put your budget.
Pro Tips for Improving CLV
- Create loyalty or rewards programs so you can encourage customers to lock in future purchases.
- Recommend best-selling or relevant products in your emails or on your order tracking page.
- Improve your customer service, such as responding faster to questions or offering quick solutions.
Metric 2: Repeat Purchase Rate (RPR)
The next metric we want to share is the repeat purchase rate, and it shows the percentage of customers who come back to buy from you again in a specific period.
If CLTV shows you the future value of a customer, RPR gives you a good figure of how well you’re keeping customers right now. It’s also easier to calculate than customer lifetime value (but never underestimate this one because it directly tells you if people actually like what you’re selling).
You can use this formula to get the RPR:
 - how-to-calculate-repeat-purchase")
Imagine you had 1,000 total customers last quarter, and 180 of them came back to buy again. That’s 180 ÷ 1,000 × 100% = 18%.
But what’s a good repeat purchase rate? It depends on which industry you’re in, but in ecommerce, 27% is the average. That means if you’re at 18%, you’re below the benchmark and need to work on getting more customers to return. The chart above breaks down how different industries compare:

Pro Tips to Increase Your RPR
- Send post-purchase follow-up emails (2-3 weeks after their first purchase) with exclusive offers.
- Offer one-click checkout options where your existing customers can reorder without filling out forms again.
- Send personalized product recommendations and suggest new items based on their purchase history.
Metric 3: Customer Retention Rate (CRR)
Returning customers spend 67% more than new customers(wow!). That’s how powerful your existing buyers are when it comes to driving revenue and how important customer retention is. You need to know where your business stands to find out whether you’re profitable enough to continue operating or… even scale.
CRR is calculated through this formula: [(CE – CN) / CS] × 100%, where:
- CE equals the number of customers at the end of a period
- CN refers to the new customers you got during that time
- CS is the customers you started with.
So many letters, right? No worries. Let me give you an example. Imagine you started October with 1,000 customers. You got 300 new ones throughout the month and ended with 550 total customers. Your calculation would be:
[(550-300) /1,000] × 100 = 25%. That means you kept almost 25% of your original customers.
Like RPR, there’s also a good benchmark to follow. For example, the average CRR for ecommerce is around 30% (and that’s understandable because of how competitive this industry is). You can check the graph below to see the numbers for other industries:

Key Strategies for Improving CRR
- Give customers exclusive content they can’t get elsewhere: You can create buying guides, care tips, or members-only webinars that add value beyond your products. So, your customers will keep engaging with your brand.
- Ask for feedback through post-purchase surveys and regular check-ins: When customers see you actually listen to their suggestions (and act on them), they’re more likely to stay.
- Build a community where customers can connect: A Facebook group or loyalty forum lets people share experiences and tips, which can strengthen their connection to your brand.
Metric 4: Purchase Frequency & AOV
Our 4th metrics are purchase frequency (how often your customers buy) and average order value (how much each of them spends). We have to track these two together because they directly impact your revenue: more frequent purchases mean more transactions, and higher order values mean more money per transaction.
Here’s how you can measure them:
- Purchase Frequency: Divide your total number of orders by the number of unique customers in the same time frame. If you had 500 orders from 200 customers last month, your purchase frequency is 2.5.
- Average Order Value (AOV): Divide your total revenue by the number of orders for a specific period. If you made $10,000 from 200 orders, your AOV is $50.
Your purchase frequency can be affected by many factors, like product type, seasonality, promotions, and your brand reputation. For example, supplements or consumables get bought more regularly, but clothes or bags are purchased less often.
Also, if you’re selling ski gear, you can expect that it’s more popular during the winter season or right before ski trip season starts.
Meanwhile, AOV can help you determine whether your upsells or premium product offerings are effective. Let’s say you own a candle shop and your current best seller is a $15 vanilla candle. You introduce a $28 premium version with longer burn time. If 70% of your customers go for the premium version, that means it’s working.
Pro Tips to Improve Purchase Frequency and AOV
- Create a bundle of related items that customers actually want together, like pairing a yoga mat with resistance bands at a small discount.
- Set free shipping thresholds (but don’t overdo it) above your current AOV so your customers will have to add one more item to qualify.
- Automate replenishment reminder emails for consumable orders like food, vitamins, makeup, or pet supplies.
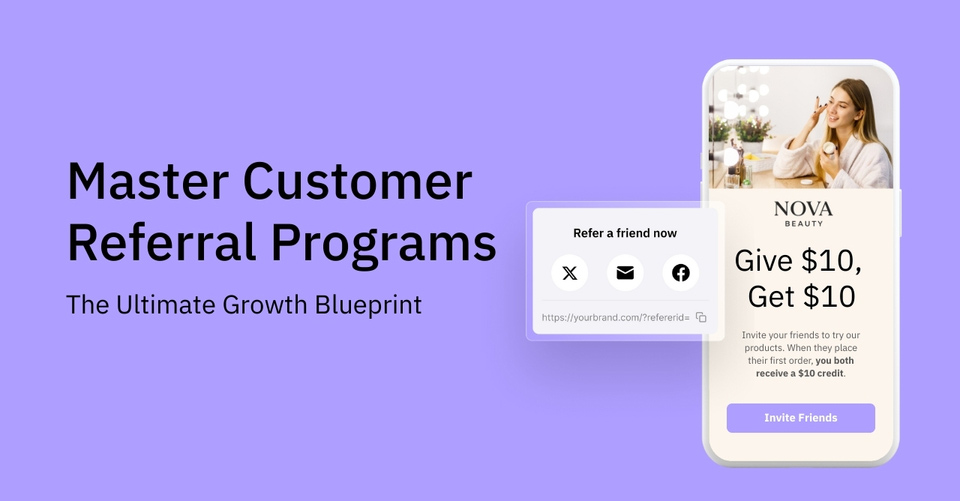
Metric 5: Referral Rate
One fascinating thing about referrals is how profitable they are in getting you more customers. It’s not only the existing customers who spend a lot, but those referred ones as well. Plus, based on research, they bring in 30-57% more new customers. (way more effective than paid ads).
That’s why you need to know your referral rate so you can see how many customers you’ve got from word-of-mouth marketing. You can calculate it by dividing the number of referral customers by your total number of new customers × 100%.
Let’s say you got seven referrals out of 200 new customers last month. That’s 7 ÷ 200 × 100% = 3.5%.
The global referral rate average is at 2.35%. If you’re an established business with happy customers and a strong product, you can expect at least 2% of your sales to come from referrals. Here’s how different industries compare:

Pro Tips for Increasing Referrals
- Launch an official referral program (with its own page) and promote it on your store site and in your email campaigns.
- Email your customers about the program and explain the rewards they’ll get for referring friends.
- Partner with influencers who share your target audience to drive more effective referrals.
Metric 6: Net Promoter Score (NPS)
Net Promoter Score is the best metric to find out if your customers would happily recommend your brand to others.
It’s one of our fave metrics because it’s fast and simple. You only have to ask one question, and that’s “On a scale of 0-10, how likely are you to recommend us to a friend or colleague?”
Then, based on your customers’ answer, they’ll fall into three groups: 9-10 are promoters (your fans), 7-8 are passives (satisfied but not enthusiastic), and 0-6 are detractors (unhappy customers who might give negative comments about your store).
You can calculate your NPS by subtracting the percentage of detractors from the percentage of promoters. If 50% of respondents are promoters and 20% are detractors, your NPS is 30.
If you want to save time and you’re working on a large customer base, you can use this free NPS calculator.
Retently mentioned that the average NPS for ecommerce is 62. So, getting a score equal to or above that will be great for you.
Pro Tips for Conducting NPS Surveys
- Send surveys 7-10 days after purchase: Your customers need time to use the product before they can give honest feedback.
- Keep it short: Ask the NPS question plus one valid (and useful) follow-up, like “What’s the main reason for your score?”
- Close the loop with detractors: Reach out personally to anyone who scores you 0-6 and see what you can do for them.
Metric 7: Customer Satisfaction Score (CSAT)
Are your customers satisfied with the support they received from you? You can measure that with the customer satisfaction score (CSAT).
Unlike NPS (which shows your brand’s recommendability), CSAT is more for tracking your customers’ satisfaction in a specific interaction. For example, you can send a CSAT survey right after a support chat to check if they’re happy with the resolution.
To calculate CSAT, ask customers to rate their satisfaction on a scale of 1-5 after a purchase or interaction. Divide the number of satisfied customers (those who picked 4 or 5) by total responses, then multiply by 100%.
Here’s what a good CSAT score looks like in different industries:

Most ecommerce stores aim for 80% or higher. If you get anywhere below that, then you might need to look into what’s causing customer dissatisfaction.
Pro Tips for Improving CSAT
- Send CSAT surveys right after key moments like delivery or support interactions (avoid sending them weeks after).
- Keep surveys short with one rating question and an optional comment box.
- Act on negative feedback fast by reaching out within 24 hours when someone rates you 1 or 2.
Metric 8: Customer Effort Score (CES)
Imagine a customer orders from your store, but the tracking link doesn’t work. They decided to call your hotline to get some news, but they were on hold for 30 minutes before someone finally located their package. How frustrating is that just to check on one order?
Customer Effort Score measures how much work customers have to put in to interact with your business. You can get your CES by asking customers one question after an interaction: “We made it easy for you to solve your problem.” They rate it on a scale from “Strongly Disagree” to “Strongly Agree” (usually 1-7).

Many issues happen in the post-purchase phase: tracking problems, return questions, and delivery concerns. You have to address these fast or at least automate the process so customers can help themselves without waiting for support.
Post-purchase platforms like ParcelPanel help you increase your CES by minimizing friction after checkout. It provides useful features like real-time order tracking, returns management, and shipping protection. Your customers get a branded tracking page with updates from 1,500+ carriers and can process returns through a self-service portal.
Pro Tips for Reducing Customer Effort
- Offer an FAQ page and help center so customers can find answers by themselves.
- Add support contact details on your checkout, order confirmation, and tracking pages.
- Simplify your return process because complicated policies can hurt your CES score.
Metric 9: Customer Loyalty Index (CLI)
Time for the last metric: Customer Loyalty Index (CLI). This one combines multiple loyalty signals into one single score.
To calculate CLI, send a survey with three questions:
- How likely are you to recommend [your company] to a friend?
- How likely are you to buy from [your company] again?
- How likely are you to try [your company]’s other products and services?
Customers rate each question on a scale of 1-6, where “1” means “very likely” and “6” means “not likely.” Take the average of all three scores for each customer, then average those scores across all customers to get your CLI. Lower scores mean stronger loyalty.
But what can affect your customer loyalty index? Based on reports, fair pricing and product quality or value matter most. About 69% of people say fair pricing keeps them coming back, and 59% say product quality drives their loyalty.
Pro Tips for Increasing CLI
- Check what similar products sell for and price competitively while highlighting your quality, without racing to the bottom.
- Prioritize product quality above everything else since broken or disappointing items destroy loyalty faster than anything.
- Send CLI surveys quarterly to track changes over time, as one score means nothing without comparison data.
Strategy and Application: Turning Metrics into Action
Setting Realistic Customer Loyalty KPIs
Most store owners set goals that look good on paper but are unrealistic (or impossible to achieve). Imagine aiming for an 80% customer retention rate when electronics stores typically sit around 40%. Or expecting a 45% repeat purchase rate in your first year when the industry average is closer to 18%.
The best approach? Check what similar stores in your industry actually achieve. You can also look at the benchmarks we covered earlier and use those as your starting point.
Additional tip: Pick 2-3 key performance indicators (KPIs) to track first. Watching ten different numbers won’t help you improve any of them.
Linking Customer Behavior to Marketing Strategies
The behavioral metrics in the table above (CLV, purchase frequency, AOV, and referral rate) give you the customer data you need to personalize your marketing approach.
Take Mejuri as an example.

The jewelry brand uses customer data from previous purchases to recommend matching pieces in their emails. If you bought gold hoops, they’ll suggest earrings or necklaces from the same collection. This increases their average order value and purchase frequency.
Pro Tips:
- Segment customers by their CLV and send different offers to high-value versus low-value groups.
- Use purchase frequency data to time your email campaigns better (don’t email weekly buyers every day).
- Track which products lead to repeat purchases and promote those more heavily to new customers.
Building a Data-Driven Customer Loyalty Program
Your loyalty program shouldn’t just hand out points for purchases. The best programs use customer feedback to understand what rewards actually matter and track performance data to see what’s working.
Here’s how to gather that feedback:
- Send a welcome survey when customers join your program: Ask what rewards they’d actually use, like discounts, free shipping, or early product access.
- Follow up with quarterly check-ins: Email your active members every few months to see if their preferences have changed.
- Review the responses and adjust your offerings: If most customers pick free shipping over points, shift your reward tiers accordingly.
You’ll need a way to track all this data, which is where Channelwill Loyalty and Referrals helps. The analytics dashboard shows you how many customers joined, what their lifetime value is, and how much revenue came from loyalty discounts and referrals.

Easy to customize your brand loyalty program
Using Sentiment Data to Drive Customer Retention
Net promoter score, customer satisfaction score, and customer effort score all reveal friction points in your customer experience. When these scores drop, you know something needs attention.
Let’s say your NPS survey shows that customers rate you low because checkout takes too long. You can act on that feedback by adding express checkout options or removing unnecessary form fields. One fashion retailer cut their checkout steps from five to three after NPS responses kept mentioning the lengthy process, and its repeat purchase rate went up by 12%.
Your Customer Loyalty Index works differently. It combines three questions (would you recommend us, would you buy again, would you try our other products) to predict churn risk. If someone scores low on repurchase likelihood, reach out with a personalized offer before they disappear.
Do you want to learn more about keeping customers around? Check out our complete guide on customer retention management.
Conclusion: Mastering the Metrics for Customer Loyalty
That’s all the metrics you have to check to improve your customer loyalty. Each one shows a different part of your strategy, from how much they spend (CLV and AOV) to how they feel about you (NPS and CSAT). Tracking these numbers tells you where to focus your efforts, whether that’s improving retention, increasing order values, or fixing friction points.
The real work starts when you track these numbers consistently and use them to improve your retention strategies.
Ready to boost your customer lifetime value and grow your loyalty program? Join over 25,000 brands that increased their revenue by up to 15% and gained up to 42% more loyalty members.
Try Channelwill Loyalty & Referrals for free.

Content Director | 9+ years decoding B2C & B2B eCommerce, obsessed with SaaS and retail storytelling
Words are my weapon—crafting killer copy, decoding trends, and turning data into gold. When not strategizing: Coffee addict, pun enthusiast, and book lover. Ready to level up your eCommerce game? Let’s chat. ☕️