Imagine putting all your efforts into winning customers, only to watch them leave after just one or two purchases (ouch).
About 69% of shoppers say they’re still loyal to specific brands in 2024. While there’s a drop from 77% in 2022, you can win if you know what makes your customers stay.
And to figure that out, you need to learn how customer loyalty analytics work.
In this post, we’ll show you the key metrics, simple strategies, and best practices that actually help brands keep their best customers.
What is Customer Loyalty Analytics?
Customer loyalty analytics are data collected and measured to understand how your customers behave over time.
It shows you more than just the repeat purchases. This analytics helps you see patterns, who your most loyal customers are, how often they engage, and what makes them stay (or leave).
Imagine that you ran an apparel brand for women. The first three months were great. You could see familiar names, and you felt everything was working well (yay!). But… the next quarter, your sales dropped a little.
So, you looked at your data and checked how your customers behaved. Turns out, most of your top customers left after you switched suppliers for your latest collection.
Whatever your business is, long-term relationships will always win vs. transactional interactions. Why? Because customers love to buy from brands that “get them.” A brand that fits their preferences and makes them feel valued through rewards.
Types of Customer Loyalty
Did you know that there are four types of customer loyalty? They are habitual, transactional, loyalty-program, and emotional.
Not familiar? No worries! I’ll introduce each to you in a simple table:
| Type | Brand Attachment | Price Sensitivity | What Makes Them Buy or Stay | Risk Factor |
| Habitual Loyals | Low | Low | Convenience and routine | May switch if something more convenient shows up |
| Transactional Loyals | Low | High | Deals, discounts, and low prices | Loyalty fades fast if offers stop or competitors beat your price |
| Loyalty-Program Loyals | High | High | Points, perks, and rewards from your loyalty program | Stay engaged as long as the program feels worth it |
| Emotional Loyals | High | Low | Strong connection, shared values, and brand identity | Least likely to leave as they love your brand and spread the word for free |
You see, your goal here is to get more emotional loyals (or at least loyalty-program ones). They have high brand attachment, and that means they’re willing to stay longer and spend more.
Key Metrics and KPIs for Customer Loyalty Analysis
Great! You now know what customer loyalty analytics is. It’s time to learn about key performance index (KPIs) and the specific loyalty metrics.
Defining Key Performance Indicators (KPIs) for Loyalty
“Key Performance Indicators” (KPIs) are measurable values that show if your customer loyalty efforts are actually effective.
There are many KPIs you can track (we’ll share them soon!). But you only have to measure the ones that connect with your goals.
If your focus is to build stronger customer relationships, then your KPIs should be things like customer satisfaction scores, repeat purchase rate, and customer lifetime value.
To help you choose the right ones, ask questions like:
- What part of the customer experience do I want to improve?
- What behavior do I want to track over time?
- Am I in for short-term wins or long-term loyalty?
Measuring Customer Satisfaction (CSAT)
Don’t worry. CSAT is not a type of standardized test. It’s a score that shows how happy your customers are after buying (or interacting) with your store.
You can measure it using a quick 1–5 scale (1 being not happy at all, five being very satisfied). Some stores even use emojis or smiley faces to keep it simple.
But what’s considered a “good” CSAT score? The American Customer Satisfaction Index (ACSI) said that 77-79% is great for retail stores. If you’re in that range, you’re doing great!
Understanding Net Promoter Score (NPS)
Net Promoter Score is a quick way to measure how likely your customers are to recommend your brand to others.
What happens is that customers rate you from 0 to 10. Those who gave 9–10 are called Promoters, 7–8 are Passives, and 0–6 are Detractors.
Then you could use this data to tell how strong your brand advocacy is. Use this formula:
NPS = % of Promoters – % of Detractors
Let’s say that you sell coffee beans. After checking your NPS, you found a drop in scores from your usual buyers. You started asking around and found the culprit: The latest blend (oops).
But you acted fast and adjusted the roast, re-sent samples, and your NPS shot back up! That also increased your orders and customer engagement.
Analyzing Customer Effort Score (CES)
Customer Effort Score (CES) measures how easy it is for your buyers to complete a task. Including checking out, getting help, or returning a product.
Here’s why you have to care about this KPI. Research shows that CES is nearly twice as good at predicting loyalty compared to other metrics (clue: CSAT and NPS).
Getting a high score means your customers didn’t have to try hard to get what they needed (nice!). And… they’re more likely to come back.
To use CES, ask buyers how easy the experience was on a scale from “very hard” to “very easy.” Then look at the results to spot friction points in your process. If too many rate you as “hard,” that’s your sign to fix what’s getting in the way.
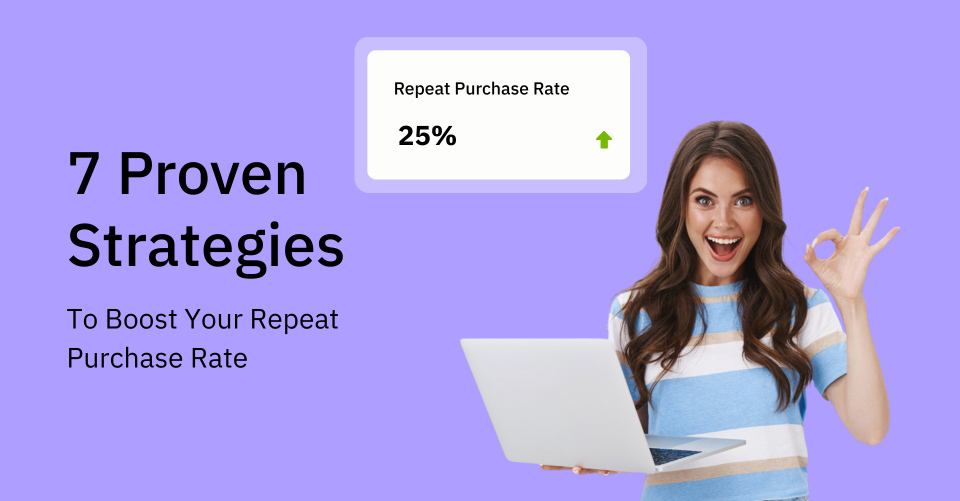
Tracking Repeat Purchase Rate
The repeat purchase rate is the percentage of your customers who make two, three, or more purchases over time.
Of course, it’s still the best way to measure customer retention rate and loyalty. Because it directly shows how customers love your product and brand. I mean, who else buys from you again and again if they’re not happy, right?
But how could you increase your repeat purchase rate? You could try customer loyalty programs, personalize your product suggestions, or perfectly time when you reach out.
One of our clients (selling pet toys and food) started their point-based loyalty program this January. Their repeat purchases went up by 45% in just two months. Thanks to the rewards plus timely reminders, their customer interaction and sales improved.
Grow your sales with Loyalty
Program & Rewards
that works
Customer Lifetime Value (CLV) Explained
Customer Lifetime Value (CLV) is the total amount of money you expect to earn from a customer over time.
It’s a great KPI to measure customer loyalty, keep an eye on your MVC (most valuable customers), and take the next best step.
Since CLV is based on long-term value, there are different ways to calculate it. The simplest way is this:
CLV = Average Order Value × Purchase Frequency × Customer Lifespan
But if you have a bigger (or growing) store, you can go for the advanced models that include customer behavior, product margins, and marketing costs.
Let’s say you run an online store selling home essentials. You noticed that your top-tier customers spend about $60 per order, shop five times a year, and usually stay active for three years.
That puts their CLV at around $900. And because of that, you can double down on keeping your existing customers happy (rather than spending twice to attract new shoppers).
Churn Rate and Its Significance
Unlike the two KPIs before this (positive ones), the churn rate’s focus is on measuring the percentage of customers who stop buying from your store within a certain period.
If it’s not a “good thing,” why should you measure it? It’s because the higher your churn rate is, the lower your customer retention is. You might be putting too much effort into getting new customers. But if you’re not keeping the old ones, that growth won’t last.
And fun fact: only 30% of ecommerce customers typically stick around after the first purchase.
So if you want to lower your churn, here are some pro tips:
- Look for gaps in customer behavior, like buyers who haven’t returned in a while
- Send follow-up emails with helpful offers or check-ins
- Use customer feedback to understand why people leave
Other Relevant Customer Loyalty Analytics Metrics
There are sooo many metrics to explore. But it would take me forever to list them all, and I don’t want you to get bored. So, here are just a few more worth mentioning to improve customer loyalty. And an itsy bitsy explanation.
Purchase frequency shows how often customers buy. Average order value tells you how much they spend. Engagement rates reflect interest. With these metrics, you can get a fuller view of overall customer behavior and loyalty.
Tools and Technologies for Loyalty Analytics
There’s no shortage of tools out there to help you make sense of your customer loyalty analytics. You don’t need to use everything. But you have to pick what fits your customer loyalty goal.
Some of the tools and technologies you can go for are CRMs, loyalty platforms, and AI. Let me explain each.
Leveraging CRM Systems for Customer Data
CRM is your partner in keeping track of the people who buy from you. With it, you can store all important customer details in one place. That includes contact info, order history, messages, and past customer interactions.
So if you need to check who your buyers were last month. Or, how many of them are repeat customers? It’s all right there. (Bye, endless email scrolling!)
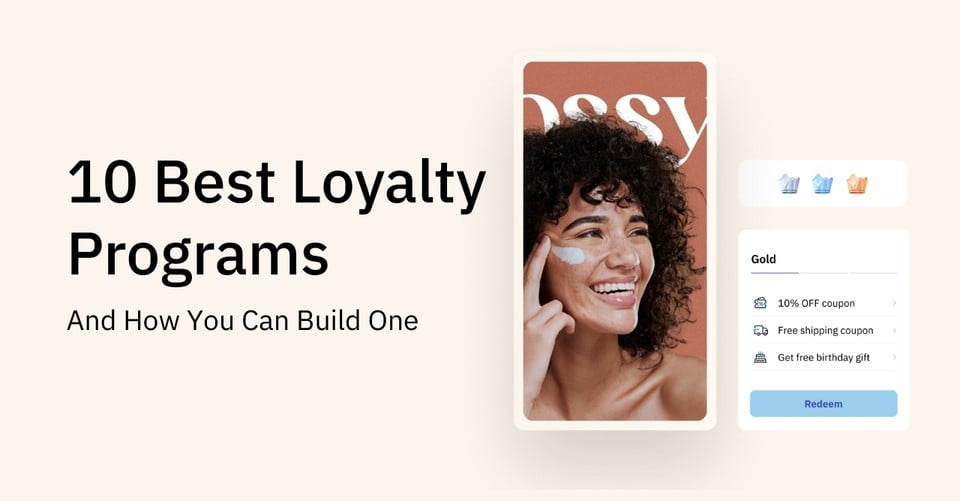
Dedicated Loyalty Programs and Platforms
Loyalty tools are designed to help you reward repeat customers and make it easy to manage points, perks, and referrals.
The best part? They handle most of the busy work automatically. You also get access to customer loyalty data that helps you improve campaigns based on what’s working and what’s not.
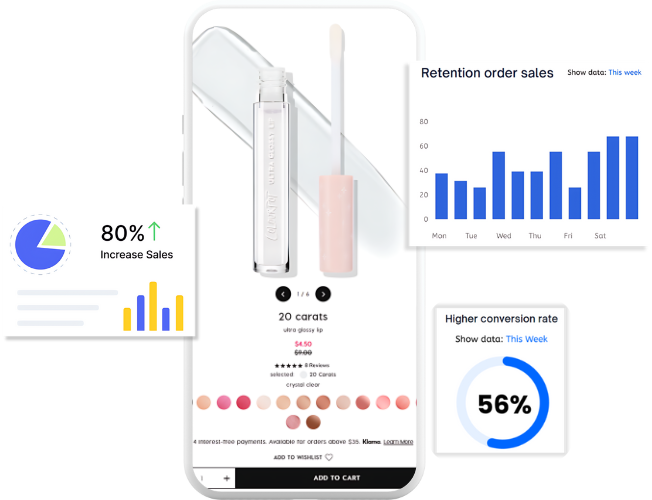
Customer Loyalty Analytics Dashboards and Reporting Tools
Dashboards turn your data into something visual and clear.
With the right setup, you can check customer sentiment, purchase behavior, and top-performing rewards at a glance. These help teams act fast without digging through spreadsheets.
The Role of AI and Machine Learning in Loyalty Analytics
And of course, how can we even forget how AI fits into this?
Don’t worry. We won’t encourage using robots to run your business (pro-humans here). But some tools use AI to help you sort through loyalty data faster. They can see trends, flag at-risk customers, and even suggest offers based on what people actually buy.
For example, beauty retailer allbeauty used AI to predict when a customer was likely to stop buying. Their efforts resulted in a 518% increase in revenue and a 414% boost in sales. Wow.
Implementing Effective Loyalty Strategies
Collecting data is great. But what’s the point if you’re not going to use them, right? Here’s how we’ve seen loyalty insights turn into better decisions (and better results).
Turning Loyalty Insights into Actionable Strategies
Let’s say your loyalty dashboard shows a dip in repeat orders after a product update. So you check the reviews and find that customers preferred the older version.
The best course of action is to bring it back, promote it to those who left, and track if your repeat rate improves. (Simple, right?)
Personalizing Customer Experiences
One of our clients, a pet supply brand, grouped its buyers by order frequency. Then they built email flows with different offers based on how often people shopped. The heavy spenders got early access. New buyers got welcome deals. Their open rates went up, and so did repeat purchases.
Enhancing Customer Engagement Initiatives
We’ve seen brands like Monki use content and community to keep shoppers engaged.
For example, short styling tips, real people in their posts, and quick replies in the comments. People don’t just buy from them. They follow along because it feels casual and real.
Best Practice of Customer Loyalty
Before we wrap up, I want to share some of the best practices that our clients stick with.
The first one is to keep your program simple. Reward customers for signing up, shopping again, or referring their friends. Don’t make it as hard as climbing Mount Everest just to get a 25% off coupon.
The second tip is to use a powerful loyalty and rewards tool. And we recommend Channelwill’s Loloyal for this.
It helps you run points programs, referral perks, and even VIP tiers without the tech headache. Plus, you can start for free. But if you’re ready to grow, you can start with paid plans for only $29/month.

Easy to customize your brand loyalty program
Do you want to see how effective that can be? Mistore.se, a Swedish tech brand, used Loloyal to sign up over 22,000 loyalty members. Their repeat customer rate went up by more than 28 percent after setting up points, a referral program, and multilingual emails.
Conclusion: Building Customer Loyalty That Sticks
You made it to the end! That means you’re serious about keeping the customers you worked so hard to win.
Want to make it easier (and more rewarding) for them to stay? Schedule a demo with our team to see how Loloyal can work for your customer retention and sales.